Basics
On a high level MMU provides two types of functionality:
Metrics - functions to compute confusion matrix(ces) and binary classification metrics over classifier scores or predictions.
Uncertainty estimators - functionality to compute the joint uncertainty over classification metrics.
Note
See the tutorial notebooks for runnable examples.
Confusion Matrix & Metrics
Metrics consist mainly of high-performance functions to compute the confusion matrix and metrics over a single test set, multiple classification thresholds and or multiple runs.
The binary_metrics functions compute the 10 most commonly used metrics:
Negative precision aka Negative Predictive Value (NPV)
Positive recision aka Positive Predictive Value (PPV)
Negative recall aka True Negative Rate (TNR) aka Specificity
Positive recall aka True Positive Rate (TPR) aka Sensitivity
Negative f1 score
Positive f1 score
False Positive Rate (FPR)
False Negative Rate (FNR)
Accuracy
Mathew’s Correlation Coefficient (MCC)
Most other metrics should be computable from these.
See API section Metrics for all the function signatures.
import mmu

# we use generated data for this example
scores, yhat, y = mmu.generate_data(n_samples=1000)

# computing the confusion matrix from the classifier scores
conf_mat = mmu.confusion_matrix(y, scores=scores)

# from predictions this would be
# conf_mat = mmu.confusion_matrix(y, yhat=yhat)

# we can compute the binary metrics from the confusion matrix or directly
metrics = mmu.binary_metrics_confusion_matrix(conf_mat)

# or directly from the scores, here we also request the results to be
dataframes
conf_mat, metrics = mmu.binary_metrics(y, scores=scores, return_df=True)
Multiple thresholds
These functions can also be applied to multiple thresholds. Say you want to compute the precision recall curve:
import mmu

# we use generated data for this example
scores, yhat, y = mmu.generate_data(n_samples=1000)

# determine the optimal classification thresholds
thresholds = mmu.auto_thresholds(scores)

# optionally we can limit the number of thresholds using ``max_steps``
# thresholds = mmu.auto_thresholds(scores, max_steps=500)

precision, recall = mmu.precision_recall_curve(y, scores, thresholds)

# if you want the confusion matrices or full set of metrics
conf_mats = mmu.confusion_matrices(y, scores=scores, thresholds=thresholds)
metrics = mmu.binary_metrics_confusion_matrices(conf_mats)

# or equivalently
conf_mats, metrics = mmu.binary_metrics_thresholds(y, scores, thresholds)
Multiple test sets
If you have multiple test sets MMU support this with runs postfix.
You can compute the metrics over runs for a single threshold or in combination
with thresholds.
import mmu

# we use generated data for this example
# note that scores and y now have shape (1000, 30)
scores, yhat, y = mmu.generate_data(n_samples=1000, n_sets=30)

# the metrics over the runs but a single threshold
metrics = mmu.binary_metrics_runs(y, scores=scores, threshold=0.5)

# linearly spaced thresholds as auto_thresholds is not suited for multiple runs.
thresholds = np.linspace(1e-12, 1-1e-12, 1000)

# if you want the confusion matrices, note that in this case we
# may need to set obs_axis. obs_axis should be zero if y and scores have the
# observations beloning to a single set as rows, and 1 if they are stored in
# over the columns
conf_mats = mmu.confusion_matrices_runs_thresholds(
    y=y,
    scores=scores,
    thresholds=thresholds,
    obs_axis=0
)

# alternatively
conf_mats, metrics = mmu.binary_metrics_runs_thresholds(
    y=y,
    scores=scores,
    thresholds=thresholds,
)
Estimators
MMU currently only supports joint statistical uncertainty estimators for precision and recall. We are working on adding more estimators.
The estimators are classes that are instantiated from class methods, following the scikit API. The following class methods are provided:
from_scoresfrom_predictionsfrom_confusion_matrixfrom_classifier
For example pr_err = mmu.PRU.from_scores(y, scores, threshold=0.82).
Precision-Recall
MMU provides two methods for modelling the joint uncertainty on precision and recall: Multinomial uncertainty and Bivariate-Normal.
Threshold vs curve uncertainty
Both methods can be applied for a specific threshold or over the precision recall curve. The curve uncertainty represents a conservative view on the uncertainty. The precision-recall grid is divided into, by default, 1000 bins per axis. For each bin in the two dimensional grid we retain the minimum score, highest probability, over the thresholds. This means that for any threshold, the curve’s CI will never be smaller than the CI of the corresponding threshold. Hence, the curve uncertainty can slightly over-cover the true confidence interval. To help with this the curve methods provide functionality to overlay threshold uncertainty(ies) on the curve.
Multinomial approach
The Multinomial approach computes the profile log-likelihoods scores for a grid around the precision and recall. The bounds of the grid are determined by n_sigmas times the standard deviation of the marginals. The scores are chi2 distributed with 2 degrees of freedom.
The Multinomial approach is usually robust for relatively low statistics tests. Additionally it is valid for the extreme values of precision and recall, which the Bivariate-Normal approach is not. However, the Multinomial approach does not allow the statistical uncertainty of the train set to be incorporated which the Bivariate-Normal does.
The multinomial approach is the default approach.
import mmu
# we use generated data for this example
# note that scores and y now have shape (1000, 30)
scores, yhat, y = mmu.generate_data(n_samples=1000)
# mmu.PRU is an alias
pr_err = mmu.PrecisionRecallUncertainty.from_scores(y, scores, 0.85)
# get the confusion matrix as a DataFrame
pr_err.get_conf_mat()
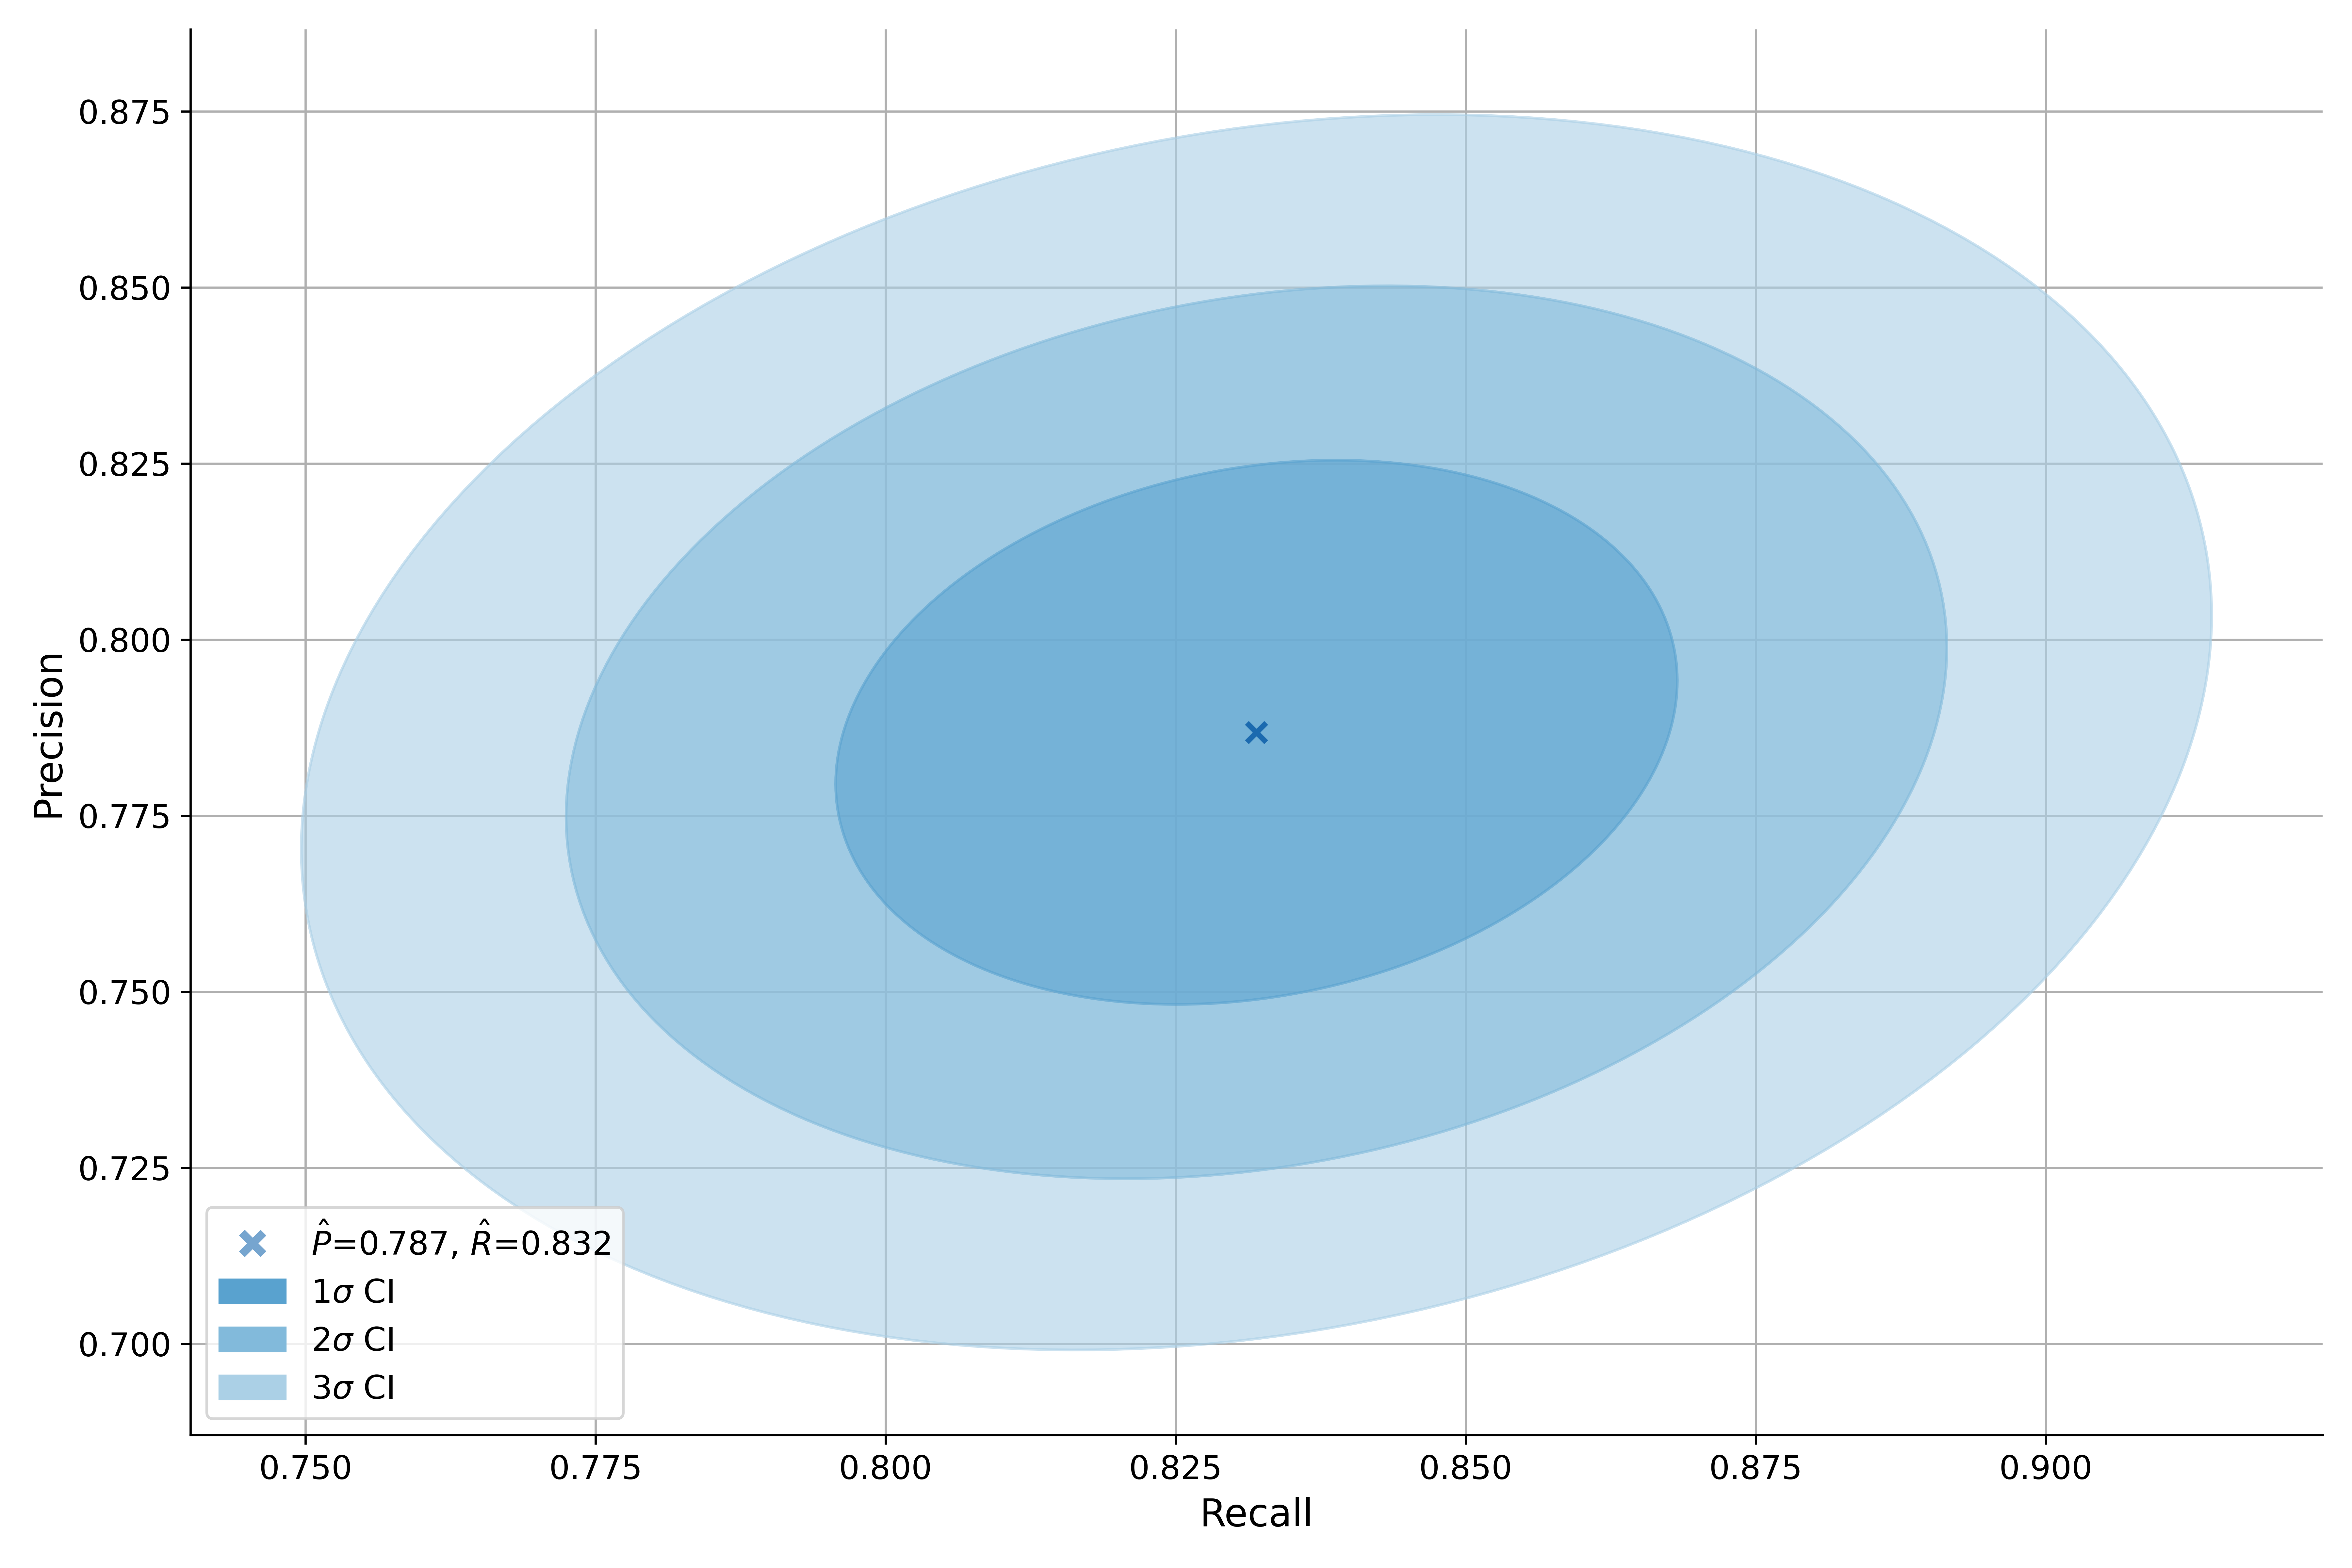
# plot the precision-recall joint uncertainty for 1, 2, and 3 standard deviations
# i.e. the approximately 68%, 95% and 99% CIs
pr_err.plot()
You can also compute and plot the uncertainty over precision-recall curve, here
we overlay the threshold uncertainty computed above.
Note that we don’t specify the threshold in this case. If thresholds is None
we compute them with mmu.auto_thresholds().
# PRCU is an alias of PrecisionRecallCurveUncertainty
pr_err_curve = mmu.PRCU.from_scores(y, scores)

# we add the threshold uncertainty using point_uncertainty argument
ax = pr_err.plot(point_uncertainty=pr_err)
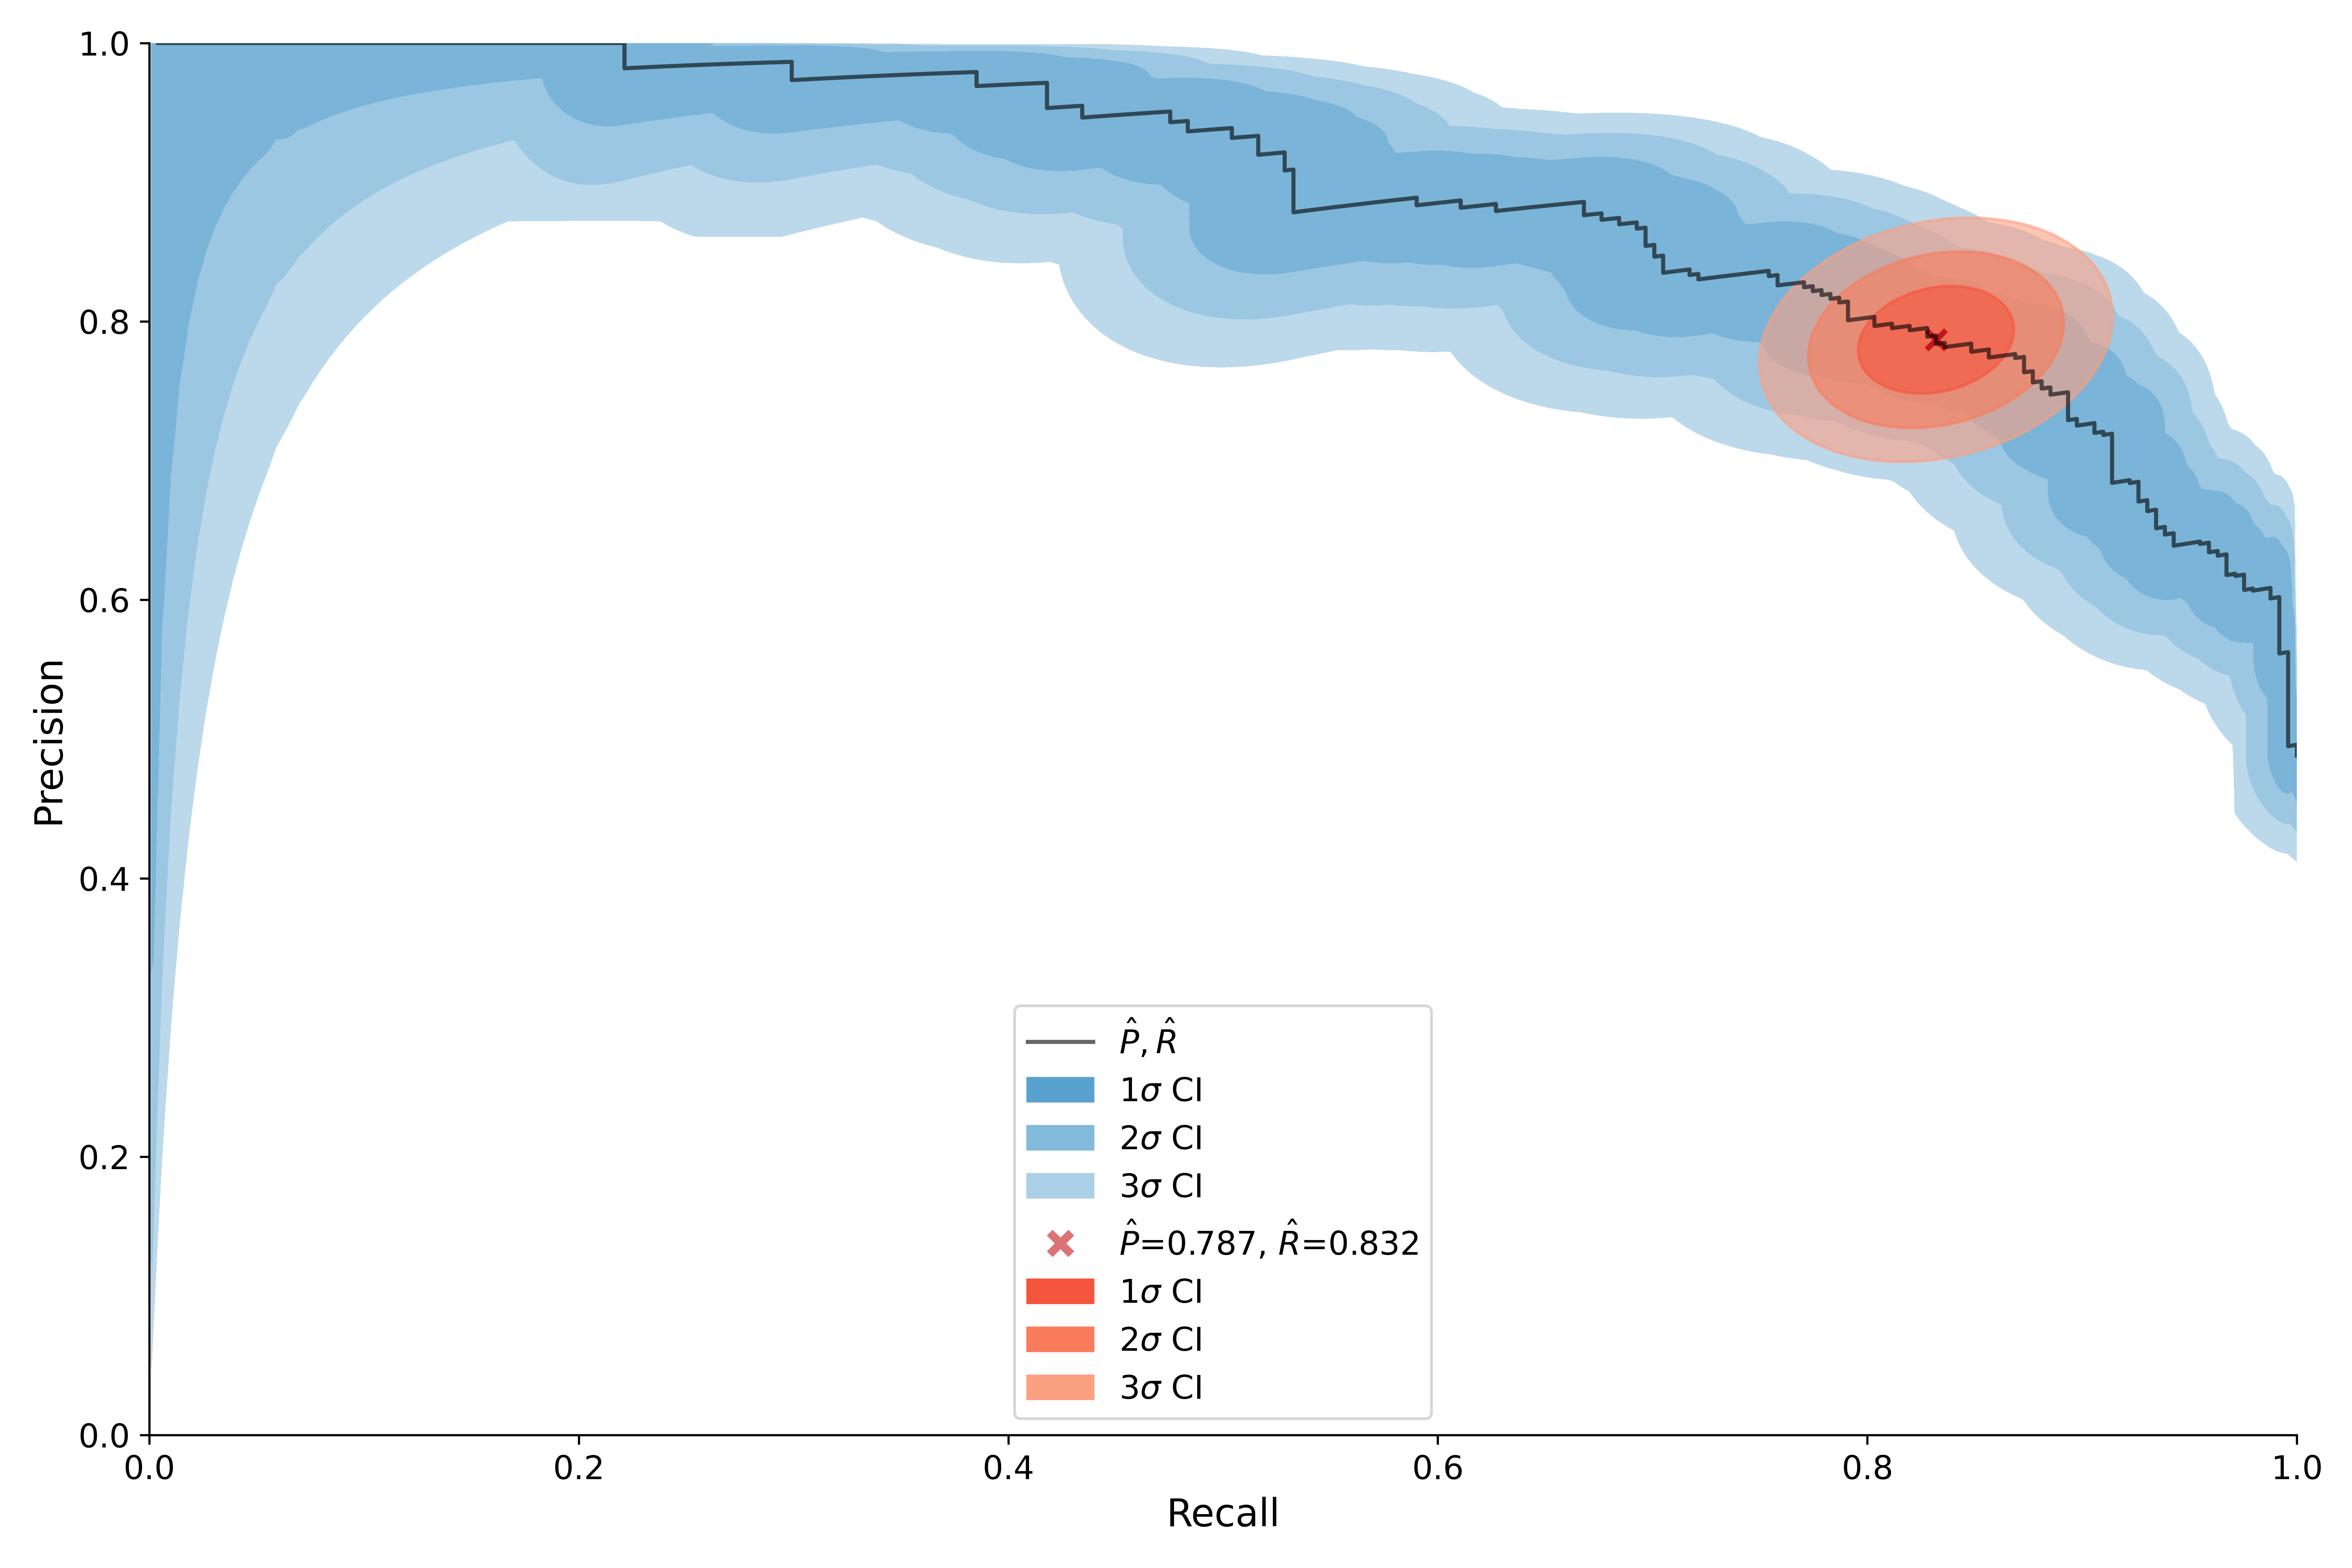
See mmu.PrecisionRecallUncertainty for details.
Bivariate-Normal approach
The statistical/sampling uncertainty over the Precision and Recall are modelled as a Bivariate-Normal over the linearly propagated errors of the confusion matrix. For a threshold/confusion matrix a covariance matrix is computed which is used to determine the elliptical uncertainty. The curve uncertainty computes chi2 scores in a similar manner to Multinomial approach.
Note that the Bivariate-Normal (Elliptical) approach is only valid for medium to high statistic datasets. A warning is raised when the Normal approximation to the Binomial may not be valid. Additionally, the estimation is not valid for the extremes of precision/recall. However, the train set uncertainty can be added to the test uncertainty.
The bivariate threshold/point uncertainty can be computed using setting
method to one of: 'bivariate', 'bvn' or , 'elliptical'.
import mmu

# we use generated data for this example
scores, yhat, y = mmu.generate_data(n_samples=1000)

# mmu.PRU is an alias
pr_err = mmu.PrecisionRecallUncertainty.from_scores(y, scores, 0.85, method='bvn')

# PRCU is an alias of PrecisionRecallCurveUncertainty
pr_err_curve = mmu.PRCU.from_scores(y, scores, method='bvn')
See mmu.PrecisionRecallUncertainty for details.
Comparing two precision-recall scores
If you want to compare two models for a given threshold you can evaluate the chi2 score of one relative to the other.
For both methods we can compute the Chi2 score for a precision, recall using the compute_score_for:
import mmu

# we use generated data for this example
scores, yhat, y = mmu.generate_data(n_samples=1000)
scores_alt, yhat_alt, y_alt = mmu.generate_data(n_samples=1000)

# mmu.PRU is an alias
pr_err = mmu.PrecisionRecallUncertainty.from_scores(y, scores, 0.85)
pr_err_alt = mmu.PRU.from_scores(y_alt, scores_alt, 0.85)
chi2_score = pr_err.compute_score_for(pr_err_alt.precision, pr_err_alt.recall)
This score can than be used for further statistical tests or one can compute the p-value directly using:
import mmu

# we use generated data for this example
scores, yhat, y = mmu.generate_data(n_samples=1000)
scores_alt, yhat_alt, y_alt = mmu.generate_data(n_samples=1000)

# mmu.PRU is an alias
pr_err = mmu.PrecisionRecallUncertainty.from_scores(y, scores, 0.85)
pr_err_alt = mmu.PRU.from_scores(y_alt, scores_alt, 0.85)
p-value = pr_err.compute_pvalue_for(pr_err_alt.precision, pr_err_alt.recall)
compute_score_for and compute_pvalue_for can be used to compute scores/p-values for a single precision, recall or arrays of precisions and recalls.
See mmu.PrecisionRecallUncertainty for details.